Skip to content

Metrics

Metrics creates custom metrics asynchronously by logging metrics to standard output following Amazon CloudWatch Embedded Metric Format (EMF).

These metrics can be visualized through Amazon CloudWatch Console.

Key features

  • Aggregate up to 100 metrics using a single CloudWatch EMF object (large JSON blob)
  • Validate against common metric definitions mistakes (metric unit, values, max dimensions, max metrics, etc)
  • Metrics are created asynchronously by CloudWatch service, no custom stacks needed
  • Context manager to create a one off metric with a different dimension

Terminologies

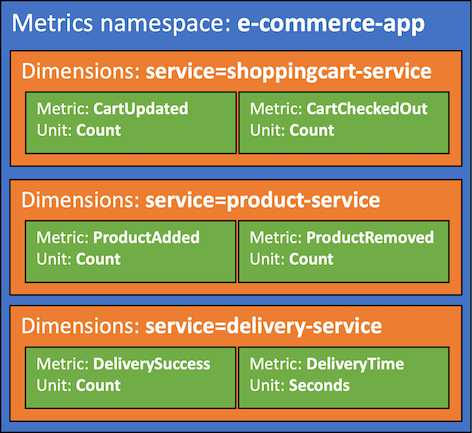
If you're new to Amazon CloudWatch, there are two terminologies you must be aware of before using this utility:

  • Namespace. It's the highest level container that will group multiple metrics from multiple services for a given application, for example ServerlessEcommerce.
  • Dimensions. Metrics metadata in key-value format. They help you slice and dice metrics visualization, for example ColdStart metric by Payment service.
Metric terminology, visually explained

Getting started

Metric has two global settings that will be used across all metrics emitted:

Setting Description Environment variable Constructor parameter
Metric namespace Logical container where all metrics will be placed e.g. ServerlessAirline POWERTOOLS_METRICS_NAMESPACE namespace
Service Optionally, sets service metric dimension across all metrics e.g. payment POWERTOOLS_SERVICE_NAME service
Tip

Use your application or main service as the metric namespace to easily group all metrics.

Example

AWS Serverless Application Model (SAM)

1
2
3
4
5
6
7
8
9
Resources:
  HelloWorldFunction:
    Type: AWS::Serverless::Function
    Properties:
      Runtime: python3.8
      Environment:
      Variables:
        POWERTOOLS_SERVICE_NAME: payment
        POWERTOOLS_METRICS_NAMESPACE: ServerlessAirline
1
2
3
4
5
6
from aws_lambda_powertools import Metrics
from aws_lambda_powertools.metrics import MetricUnit

metrics = Metrics() # Sets metric namespace and service via env var
# OR
metrics = Metrics(namespace="ServerlessAirline", service="orders") # Sets metric namespace, and service as a metric dimension

Creating metrics

You can create metrics using add_metric, and you can create dimensions for all your aggregate metrics using add_dimension method.

Tip

You can initialize Metrics in any other module too. It'll keep track of your aggregate metrics in memory to optimize costs (one blob instead of multiples).

1
2
3
4
5
6
7
8
from aws_lambda_powertools import Metrics
from aws_lambda_powertools.metrics import MetricUnit

metrics = Metrics(namespace="ExampleApplication", service="booking")

@metrics.log_metrics
def lambda_handler(evt, ctx):
    metrics.add_metric(name="SuccessfulBooking", unit=MetricUnit.Count, value=1)
1
2
3
4
5
6
7
8
9
from aws_lambda_powertools import Metrics
from aws_lambda_powertools.metrics import MetricUnit

metrics = Metrics(namespace="ExampleApplication", service="booking")

@metrics.log_metrics
def lambda_handler(evt, ctx):
    metrics.add_dimension(name="environment", value="prod")
    metrics.add_metric(name="SuccessfulBooking", unit=MetricUnit.Count, value=1)
Tip: Autocomplete Metric Units

MetricUnit enum facilitate finding a supported metric unit by CloudWatch. Alternatively, you can pass the value as a string if you already know them e.g. "Count".

Note: Metrics overflow

CloudWatch EMF supports a max of 100 metrics per batch. Metrics utility will flush all metrics when adding the 100th metric. Subsequent metrics, e.g. 101th, will be aggregated into a new EMF object, for your convenience.

Warning: Do not create metrics or dimensions outside the handler

Metrics or dimensions added in the global scope will only be added during cold start. Disregard if you that's the intended behaviour.

Adding default dimensions

You can use either set_default_dimensions method or default_permissions parameter in log_metrics decorator to persist dimensions across Lambda invocations.

If you'd like to remove them at some point, you can use clear_default_dimensions method.

1
2
3
4
5
6
7
8
9
from aws_lambda_powertools import Metrics
from aws_lambda_powertools.metrics import MetricUnit

metrics = Metrics(namespace="ExampleApplication", service="booking")
metrics.set_default_dimensions(environment="prod", another="one")

@metrics.log_metrics
def lambda_handler(evt, ctx):
    metrics.add_metric(name="SuccessfulBooking", unit=MetricUnit.Count, value=1)
1
2
3
4
5
6
7
8
9
from aws_lambda_powertools import Metrics
from aws_lambda_powertools.metrics import MetricUnit

metrics = Metrics(namespace="ExampleApplication", service="booking")
DEFAULT_DIMENSIONS = {"environment": "prod", "another": "one"}

@metrics.log_metrics(default_dimensions=DEFAULT_DIMENSIONS)
def lambda_handler(evt, ctx):
    metrics.add_metric(name="SuccessfulBooking", unit=MetricUnit.Count, value=1)

Flushing metrics

As you finish adding all your metrics, you need to serialize and flush them to standard output. You can do that automatically with the log_metrics decorator.

This decorator also validates, serializes, and flushes all your metrics. During metrics validation, if no metrics are provided then a warning will be logged, but no exception will be raised.

1
2
3
4
5
6
7
8
from aws_lambda_powertools import Metrics
from aws_lambda_powertools.metrics import MetricUnit

metrics = Metrics(namespace="ExampleApplication", service="ExampleService")

@metrics.log_metrics
def lambda_handler(evt, ctx):
    metrics.add_metric(name="BookingConfirmation", unit=MetricUnit.Count, value=1)
 1
 2
 3
 4
 5
 6
 7
 8
 9
10
11
12
13
14
15
16
17
18
19
20
21
22
23
{
    "BookingConfirmation": 1.0,
    "_aws": {
    "Timestamp": 1592234975665,
    "CloudWatchMetrics": [
        {
        "Namespace": "ExampleApplication",
        "Dimensions": [
            [
            "service"
            ]
        ],
        "Metrics": [
            {
            "Name": "BookingConfirmation",
            "Unit": "Count"
            }
        ]
        }
    ]
    },
    "service": "ExampleService"
}
Tip: Metric validation

If metrics are provided, and any of the following criteria are not met, SchemaValidationError exception will be raised:

  • Maximum of 8 user-defined dimensions
  • Namespace is set, and no more than one
  • Metric units must be supported by CloudWatch

Raising SchemaValidationError on empty metrics

If you want to ensure at least one metric is always emitted, you can pass raise_on_empty_metrics to the log_metrics decorator:

Raising SchemaValidationError exception if no metrics are added
1
2
3
4
5
6
7
from aws_lambda_powertools.metrics import Metrics

metrics = Metrics()

@metrics.log_metrics(raise_on_empty_metrics=True)
def lambda_handler(evt, ctx):
    ...
Suppressing warning messages on empty metrics

If you expect your function to execute without publishing metrics every time, you can suppress the warning with warnings.filterwarnings("ignore", "No metrics to publish*").

Nesting multiple middlewares

When using multiple middlewares, use log_metrics as your last decorator wrapping all subsequent ones to prevent early Metric validations when code hasn't been run yet.

Example with multiple decorators
 1
 2
 3
 4
 5
 6
 7
 8
 9
10
from aws_lambda_powertools import Metrics, Tracer
from aws_lambda_powertools.metrics import MetricUnit

tracer = Tracer(service="booking")
metrics = Metrics(namespace="ExampleApplication", service="booking")

@metrics.log_metrics
@tracer.capture_lambda_handler
def lambda_handler(evt, ctx):
    metrics.add_metric(name="BookingConfirmation", unit=MetricUnit.Count, value=1)

Capturing cold start metric

You can optionally capture cold start metrics with log_metrics decorator via capture_cold_start_metric param.

Generating function cold start metric
1
2
3
4
5
6
7
from aws_lambda_powertools import Metrics

metrics = Metrics(service="ExampleService")

@metrics.log_metrics(capture_cold_start_metric=True)
def lambda_handler(evt, ctx):
    ...

If it's a cold start invocation, this feature will:

  • Create a separate EMF blob solely containing a metric named ColdStart
  • Add function_name and service dimensions

This has the advantage of keeping cold start metric separate from your application metrics, where you might have unrelated dimensions.

Info

We do not emit 0 as a value for ColdStart metric for cost reasons. Let us know if you'd prefer a flag to override it.

Advanced

Adding metadata

You can add high-cardinality data as part of your Metrics log with add_metadata method. This is useful when you want to search highly contextual information along with your metrics in your logs.

Info

This will not be available during metrics visualization - Use dimensions for this purpose

1
2
3
4
5
6
7
8
9
from aws_lambda_powertools import Metrics
from aws_lambda_powertools.metrics import MetricUnit

metrics = Metrics(namespace="ExampleApplication", service="booking")

@metrics.log_metrics
def lambda_handler(evt, ctx):
    metrics.add_metric(name="SuccessfulBooking", unit=MetricUnit.Count, value=1)
    metrics.add_metadata(key="booking_id", value="booking_uuid")
 1
 2
 3
 4
 5
 6
 7
 8
 9
10
11
12
13
14
15
16
17
18
19
20
21
22
23
24
{
    "SuccessfulBooking": 1.0,
    "_aws": {
    "Timestamp": 1592234975665,
    "CloudWatchMetrics": [
        {
        "Namespace": "ExampleApplication",
        "Dimensions": [
            [
            "service"
            ]
        ],
        "Metrics": [
            {
            "Name": "SuccessfulBooking",
            "Unit": "Count"
            }
        ]
        }
    ]
    },
    "service": "booking",
    "booking_id": "booking_uuid"
}

Single metric with a different dimension

CloudWatch EMF uses the same dimensions across all your metrics. Use single_metric if you have a metric that should have different dimensions.

Info

Generally, this would be an edge case since you pay for unique metric. Keep the following formula in mind:

unique metric = (metric_name + dimension_name + dimension_value)

Generating an EMF blob with a single metric
1
2
3
4
5
6
7
8
from aws_lambda_powertools import single_metric
from aws_lambda_powertools.metrics import MetricUnit


def lambda_handler(evt, ctx):
    with single_metric(name="ColdStart", unit=MetricUnit.Count, value=1, namespace="ExampleApplication") as metric:
        metric.add_dimension(name="function_context", value="$LATEST")
        ...

Flushing metrics manually

If you prefer not to use log_metrics because you might want to encapsulate additional logic when doing so, you can manually flush and clear metrics as follows:

Warning

Metrics, dimensions and namespace validation still applies

Manually flushing and clearing metrics from memory
 1
 2
 3
 4
 5
 6
 7
 8
 9
10
11
import json
from aws_lambda_powertools import Metrics
from aws_lambda_powertools.metrics import MetricUnit

metrics = Metrics(namespace="ExampleApplication", service="booking")

def lambda_handler(evt, ctx):
    metrics.add_metric(name="ColdStart", unit=MetricUnit.Count, value=1)
    your_metrics_object = metrics.serialize_metric_set()
    metrics.clear_metrics()
    print(json.dumps(your_metrics_object))

Testing your code

Environment variables

Tip

Ignore this section, if you are explicitly setting namespace/default dimension via namespace and service parameters.

For example, Metrics(namespace=ApplicationName, service=ServiceName)

Use POWERTOOLS_METRICS_NAMESPACE and POWERTOOLS_SERVICE_NAME env vars when unit testing your code to ensure metric namespace and dimension objects are created, and your code doesn't fail validation.

Injecting dummy Metric Namespace before running tests
1
POWERTOOLS_SERVICE_NAME="Example" POWERTOOLS_METRICS_NAMESPACE="Application" python -m pytest

Clearing metrics

Metrics keep metrics in memory across multiple instances. If you need to test this behaviour, you can use the following Pytest fixture to ensure metrics are reset incl. cold start:

Clearing metrics between tests
1
2
3
4
5
6
7
8
@pytest.fixture(scope="function", autouse=True)
def reset_metric_set():
    # Clear out every metric data prior to every test
    metrics = Metrics()
    metrics.clear_metrics()
    metrics_global.is_cold_start = True  # ensure each test has cold start
    metrics.clear_default_dimensions()   # remove persisted default dimensions, if any
    yield

Functional testing

As metrics are logged to standard output, you can read standard output and assert whether metrics are present. Here's an example using pytest with capsys built-in fixture:

 1
 2
 3
 4
 5
 6
 7
 8
 9
10
11
12
13
14
15
16
17
18
19
20
21
22
23
24
from aws_lambda_powertools import Metrics
from aws_lambda_powertools.metrics import MetricUnit

import json

def test_log_metrics(capsys):
    # GIVEN Metrics is initialized
    metrics = Metrics(namespace="ServerlessAirline")

    # WHEN we utilize log_metrics to serialize
    # and flush all metrics at the end of a function execution
    @metrics.log_metrics
    def lambda_handler(evt, ctx):
        metrics.add_metric(name="SuccessfulBooking", unit=MetricUnit.Count, value=1)
        metrics.add_dimension(name="environment", value="prod")

    lambda_handler({}, {})
    log = capsys.readouterr().out.strip()  # remove any extra line
    metrics_output = json.loads(log)  # deserialize JSON str

    # THEN we should have no exceptions
    # and a valid EMF object should be flushed correctly
    assert "SuccessfulBooking" in log  # basic string assertion in JSON str
    assert "SuccessfulBooking" in metrics_output["_aws"]["CloudWatchMetrics"][0]["Metrics"][0]["Name"]
 1
 2
 3
 4
 5
 6
 7
 8
 9
10
11
12
13
14
15
16
17
18
19
20
21
22
23
24
25
26
27
28
29
30
31
32
from aws_lambda_powertools import Metrics
from aws_lambda_powertools.metrics import MetricUnit

from collections import namedtuple

import json

def capture_metrics_output_multiple_emf_objects(capsys):
    return [json.loads(line.strip()) for line in capsys.readouterr().out.split("\n") if line]

def test_log_metrics(capsys):
    # GIVEN Metrics is initialized
    metrics = Metrics(namespace="ServerlessAirline")

    # WHEN log_metrics is used with capture_cold_start_metric
    @metrics.log_metrics(capture_cold_start_metric=True)
    def lambda_handler(evt, ctx):
        metrics.add_metric(name="SuccessfulBooking", unit=MetricUnit.Count, value=1)
        metrics.add_dimension(name="environment", value="prod")

    # log_metrics uses function_name property from context to add as a dimension for cold start metric
    LambdaContext = namedtuple("LambdaContext", "function_name")
    lambda_handler({}, LambdaContext("example_fn")

    cold_start_blob, custom_metrics_blob = capture_metrics_output_multiple_emf_objects(capsys)

    # THEN ColdStart metric and function_name dimension should be logged
    # in a separate EMF blob than the application metrics
    assert cold_start_blob["ColdStart"] == [1.0]
    assert cold_start_blob["function_name"] == "example_fn"

    assert "SuccessfulBooking" in custom_metrics_blob  # as per previous example
Tip

For more elaborate assertions and comparisons, check out our functional testing for Metrics utility.


Last update: 2022-06-07
Back to top